
Bayesian Belief Network
2015/06/25
Bayesian belief network is a graph that shows probabilistic dependencies among all nodes, in which the possible values for each node is countable and discrete. For example, a person health is probabilitically depended on many factors. One factor can be whether he or she smokes cigarette or not. Graphically, this example can be shown as following:
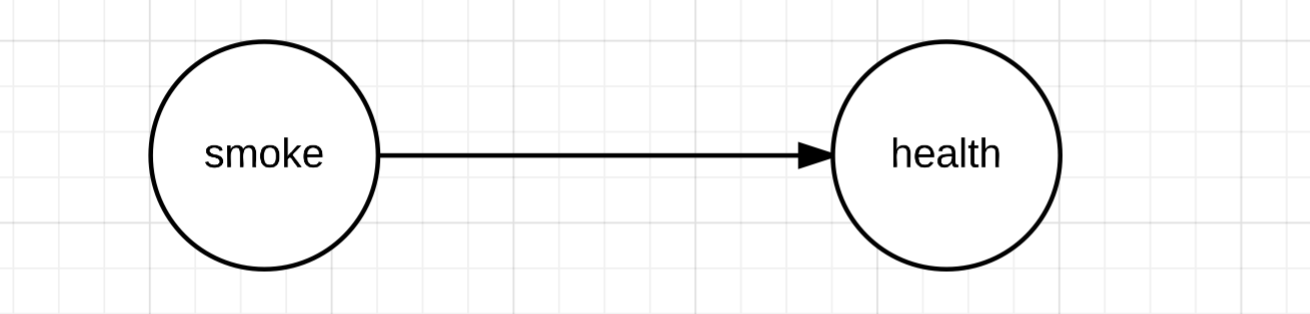 Mathematically, this graph tells us that $P(Health|smoke) \neq P(Health)$. In other words, given the person smokes or not, the probability of the person being healthy or not is different than if the information is not given. In this simple example, the node dependency is obvious to us, due to our prior knowledge about smoking and health. But when we encounter new nodes that we are not familiar, making a dependency graph is difficult, especially when the number of nodes is big. In science, we often have data collected by doing experiments, and we want to uncover dependencies among all nodes(factors). So a method to induce a best bayesian belief network for nodes is attractive.
How to find such graph? Let's say we have been given data $D = \{x_1,x_2,x_3,...x_M\}$, where $x_i$ is one realization of nodes $X$ with length $N$. Let $G_s$ denote one example of a graph. By bayes' rule, the probability of $G_s$ given the data is:
\begin{equation} P(G_s|D) = \frac{P(D|G_s)P(G_s)}{P(D)} \label{eq:graph_prob} \end{equation}
Finding a best graph means finding a $G_s$ that maximize \eqref{eq:graph_prob}. Let $L$ denote the term being maximized for finding the best graph. Since $P(D)$ is constant for every graphs, $L$ reduces to $P(D|G_s)P(G_s)$. Let $\pi_i$ denote the set of parent nodes for $x_i$, then $P(D|G_s)$ can be expended to $\prod_{i=1}^M P(x_i|\pi_i)$. Let $x_{ij}$ and $\pi_{ij}$ denote each node and parents for the node, then the equation can be furthur expanded to $\prod_{i=1}^M \prod_{j=1}^N P(x_{ij}|\pi_{ij})$. Putting everything together:
\[L = \prod_{i=1}^M \prod_{j=1}^N P(x_{ij}|\pi_{ij}) P(G_s)\]This equation is mising something important, which is the probability assigments of each node for all possible realizations of parents nodes. To fix it, $q$ is introduced as the probability assignments. And then we integrate over all possible $q$, which denote as $Q$. Note that the integral is multiple integral. Thus:
\[L = P(G_s) \int_{Q} \prod_{i=1}^M \prod_{j=1}^N P(x_{ij}|\pi_{ij},q) P(q) dq\]So given the data, how one can calculate the $L$. The paper [1] page 315 gives the method to actually calculate $L$. now when we have the way to calculate the probability given a graph, then we can exhaustive try out all possible graphes and find the one with highest probability. However, the number of graphes is huge and exhaustively search for the best one is intractable. So the paper [1] also gives several heuristics(practical ways of searching) to find the best one. One heuristic is simply order the nodes and only nodes preceding can be parents for each node, which significantly reduce the size of possible graphes.
reference:
1. A Bayesian method for the induction of probabilistic networks from data
Machine Learning, 1992, Volume 9, Number 4, Page 309
Gregory F. Cooper, Edward Herskovits